Multiple Choice
Figure 52.1 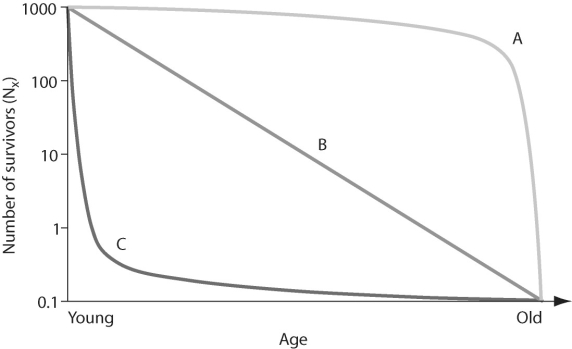
-In Figure 52.1,which of the following survivorship curves applies to most plant species?
A) curve A
B) curve B
C) curve C
D) none of the above
Correct Answer:

Verified
Correct Answer:
Verified
Q14: Given that fertility rate is defined as
Q15: Use the following abstract from Theoretical Population
Q17: During the Lacerta vivipara lizard study,researchers monitored
Q18: Figure 52.13 <img src="https://d2lvgg3v3hfg70.cloudfront.net/TB3734/.jpg" alt="Figure 52.13
Q20: The regular fluctuations in size of animal
Q21: Figure 52.6 <img src="https://d2lvgg3v3hfg70.cloudfront.net/TB3734/.jpg" alt="Figure 52.6
Q22: It is estimated that snow geese will
Q23: Figure 52.12 <img src="https://d2lvgg3v3hfg70.cloudfront.net/TB3734/.jpg" alt="Figure 52.12
Q24: If 40 individuals were alive in 1921
Q48: The definition of a generation is _.<br>A)