Multiple Choice
Figure 52.13 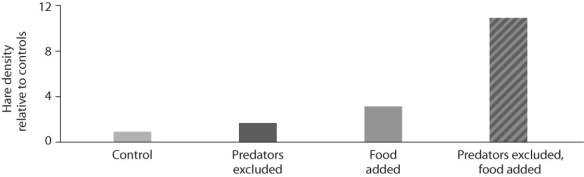
-Looking at the data in Figure 52.13 from the hare/lynx experiment,what conclusion can you draw?
A) Food is a factor in controlling hare population size.
B) Excluding lynx are a factor in controlling hare population size.
C) The effect of excluding predators and adding food in the same experiment is greater than the sum of excluding lynx alone plus adding food alone.
D) Only A and B are correct.
E) Choices A,B,and C are correct.
Correct Answer:

Verified
Correct Answer:
Verified
Q13: Use the following abstract from Theoretical Population
Q14: Given that fertility rate is defined as
Q15: Use the following abstract from Theoretical Population
Q17: During the Lacerta vivipara lizard study,researchers monitored
Q19: Figure 52.1 <img src="https://d2lvgg3v3hfg70.cloudfront.net/TB3734/.jpg" alt="Figure 52.1
Q20: The regular fluctuations in size of animal
Q21: Figure 52.6 <img src="https://d2lvgg3v3hfg70.cloudfront.net/TB3734/.jpg" alt="Figure 52.6
Q22: It is estimated that snow geese will
Q23: Figure 52.12 <img src="https://d2lvgg3v3hfg70.cloudfront.net/TB3734/.jpg" alt="Figure 52.12
Q48: The definition of a generation is _.<br>A)