Multiple Choice
Figure 52.6 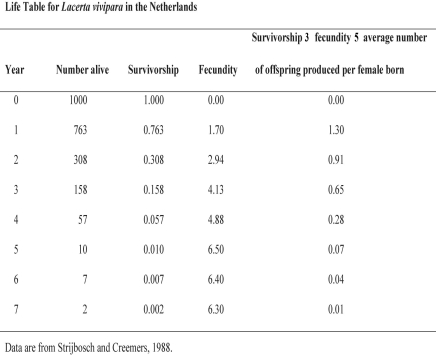
-Using Figure 52.6,calculate the net reproductive rate (R₀) for this population.
A) 2) 00
B) 3) 26
C) 1) 30
D) 2) 31
Correct Answer:

Verified
Correct Answer:
Verified
Q17: During the Lacerta vivipara lizard study,researchers monitored
Q18: Figure 52.13 <img src="https://d2lvgg3v3hfg70.cloudfront.net/TB3734/.jpg" alt="Figure 52.13
Q19: Figure 52.1 <img src="https://d2lvgg3v3hfg70.cloudfront.net/TB3734/.jpg" alt="Figure 52.1
Q20: The regular fluctuations in size of animal
Q22: It is estimated that snow geese will
Q23: Figure 52.12 <img src="https://d2lvgg3v3hfg70.cloudfront.net/TB3734/.jpg" alt="Figure 52.12
Q24: If 40 individuals were alive in 1921
Q25: Figure 52.3 <img src="https://d2lvgg3v3hfg70.cloudfront.net/TB3734/.jpg" alt="Figure 52.3
Q26: Figure 52.10 <img src="https://d2lvgg3v3hfg70.cloudfront.net/TB3734/.jpg" alt="Figure 52.10
Q48: The definition of a generation is _.<br>A)