Multiple Choice
Figure 52.8 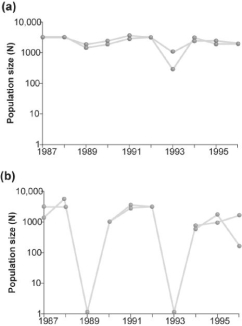
-Which of the two graphs in Figure 52.8 shows a population of organisms that has a strong population cycle?
A) (a)
B) (b)
Correct Answer:

Verified
Correct Answer:
Verified
Q5: It is estimated that a flock of
Q33: If 60 snow geese were alive in
Q37: Figure 52.7 <img src="https://d2lvgg3v3hfg70.cloudfront.net/TB3734/.jpg" alt="Figure 52.7
Q38: A model that estimates the likelihood that
Q39: Suppose researchers marked 800 turtles and later
Q40: Figure 52.9 <img src="https://d2lvgg3v3hfg70.cloudfront.net/TB3734/.jpg" alt="Figure 52.9
Q41: Figure 52.4 <img src="https://d2lvgg3v3hfg70.cloudfront.net/TB3734/.jpg" alt="Figure 52.4
Q42: You observe two female fish of the
Q43: Figure 52.14 <img src="https://d2lvgg3v3hfg70.cloudfront.net/TB3734/.jpg" alt="Figure 52.14
Q45: Figure 52.1 <img src="https://d2lvgg3v3hfg70.cloudfront.net/TB3734/.jpg" alt="Figure 52.1