Multiple Choice
Use the figure below to answer the following questions.
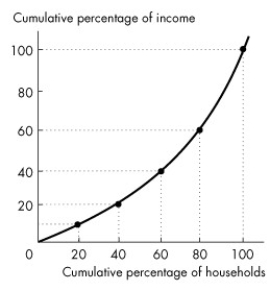
Figure 19.1.3
-In Figure 19.1.3, the poorest 20 percent of all families receive what share of income?
A) 10 percent
B) 20 percent
C) 30 percent
D) 40 percent
E) 50 percent
Correct Answer:

Verified
Correct Answer:
Verified
Related Questions
Q1: The main reason that wealth inequality persists
Q2: Use the figure below to answer the
Q3: Use the figure below to answer the
Q4: Use the table below to answer the
Q6: Between 1976 and 2011, the Canadian Gini
Q7: Which diagram is used by economists to
Q8: Use the figure below to answer the
Q9: Use the figure below to answer the
Q11: Use the figure below to answer the
Q62: Discrimination _ workers in the group being