Multiple Choice
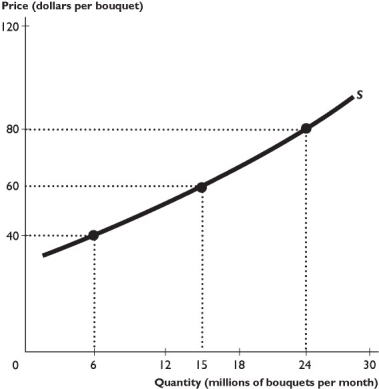
The figure above shows the supply curve for roses.
-Suppose a decrease in supply raises the price from $4.00 to $5.50 and decreases the quantity demanded from 2,000 to 1,500.Using the midpoint method,the elasticity of demand equals
A) 2.10.
B) 1.11.
C) 0.90.
D) 0.72.
E) None of the above answers is correct.
Correct Answer:

Verified
Correct Answer:
Verified
Q150: If the price of a a good
Q151: <img src="https://d2lvgg3v3hfg70.cloudfront.net/TB1458/.jpg" alt=" -Using the data
Q152: Suppose an increase in demand causes the
Q153: <img src="https://d2lvgg3v3hfg70.cloudfront.net/TB1458/.jpg" alt=" -In the figure
Q154: If the price elasticity of demand for
Q156: If the cross elasticity of demand is
Q157: If a firm supplies 200 units at
Q159: We calculate the price elasticity of demand
Q160: Suppose the price of a ticket to
Q519: <img src="https://d2lvgg3v3hfg70.cloudfront.net/TB8586/.jpg" alt=" -In the figure