Multiple Choice
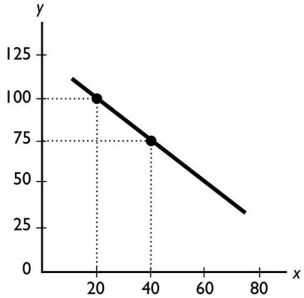
The slope of the line shown in the above figure is
A) -1 2/3.
B) -0.80.
C) -1.25.
D) 5.
E) -1 1/3.
Correct Answer:

Verified
Correct Answer:
Verified
Related Questions
Q55: <img src="https://d2lvgg3v3hfg70.cloudfront.net/TB1012/.jpg" alt=" The figure above
Q56: <img src="https://d2lvgg3v3hfg70.cloudfront.net/TB1012/.jpg" alt=" In the figure
Q57: Amy can study for an hour or
Q59: With y measured on the vertical axis
Q61: To economists,scarcity means that<br>A)there can never be
Q62: Trend refers to<br>A)a general tendency for a
Q63: Which of the following statements is true
Q64: <img src="https://d2lvgg3v3hfg70.cloudfront.net/TB1012/.jpg" alt=" The slope of
Q65: The additional benefit of increasing some activity
Q93: <img src="https://d2lvgg3v3hfg70.cloudfront.net/TB1458/.jpg" alt=" -In the above