Multiple Choice
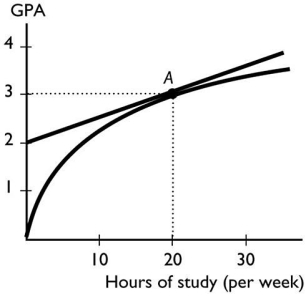
The figure above shows the relationship between the time a student spends studying and the student's GPA that semester.The slope of the relationship at point A equals
A) 1/20.
B) 3/20.
C) 3.
D) 0.
E) 2/20.
Correct Answer:

Verified
Correct Answer:
Verified
Related Questions
Q50: A choice made by comparing all relevant
Q51: When the Adelaide Crows score more than
Q52: A graph that shows how the amount
Q53: If the change in y = 10
Q54: The benefit from a good or service
Q56: <img src="https://d2lvgg3v3hfg70.cloudfront.net/TB1012/.jpg" alt=" In the figure
Q57: Amy can study for an hour or
Q59: With y measured on the vertical axis
Q60: <img src="https://d2lvgg3v3hfg70.cloudfront.net/TB1012/.jpg" alt=" The slope of
Q93: <img src="https://d2lvgg3v3hfg70.cloudfront.net/TB1458/.jpg" alt=" -In the above