Multiple Choice
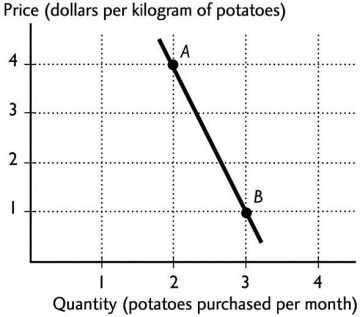
In the figure above,between points A and B,what is the slope of the line?
A) 0
B) -3
C) 4
D) 1
E) 3
Correct Answer:

Verified
Correct Answer:
Verified
Related Questions
Q51: When the Adelaide Crows score more than
Q52: A graph that shows how the amount
Q53: If the change in y = 10
Q54: The benefit from a good or service
Q55: <img src="https://d2lvgg3v3hfg70.cloudfront.net/TB1012/.jpg" alt=" The figure above
Q57: Amy can study for an hour or
Q59: With y measured on the vertical axis
Q60: <img src="https://d2lvgg3v3hfg70.cloudfront.net/TB1012/.jpg" alt=" The slope of
Q61: To economists,scarcity means that<br>A)there can never be
Q93: <img src="https://d2lvgg3v3hfg70.cloudfront.net/TB1458/.jpg" alt=" -In the above