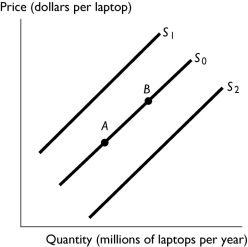
Multiple Choice

-The above figure shows the market for laptops.Which of the following shifts the supply curve from S₀ to S₂?
A) An increase in the cost of hard drives.
B) An increase in the productivity of the workers manufacturing laptops.
C) A decrease in the price of laptops.
D) An increase in the price of laptops.
E) A decrease in the number of laptop manufactures and sellers.
Correct Answer:

Verified
Correct Answer:
Verified
Q17: Suppose that the price of flour used
Q86: <img src="https://d2lvgg3v3hfg70.cloudfront.net/TB1458/.jpg" alt=" -The graph illustrates
Q100: The equilibrium price of a good occurs
Q114: The law of supply states that other
Q133: <img src="https://d2lvgg3v3hfg70.cloudfront.net/TB1458/.jpg" alt=" -In the above
Q138: Market equilibrium occurs when<br>A)all markets become equal.<br>B)the
Q181: When personal computers were first produced,the price
Q188: Consider the market for camera film.If more
Q256: Suppose that over the next few years
Q325: <img src="https://d2lvgg3v3hfg70.cloudfront.net/TB1458/.jpg" alt=" -The above figure