Multiple Choice
The figure given below represents the total output and price produced in an oligopoly market characterized by a dominant firm and a fringe.SF represents the supply curve of the fringe, D is the market demand curve, DRES represents the residual demand curve of the dominant firm, MRRES represents the residual marginal revenue curve of the dominant firm, and MCD represents the marginal cost of the dominant firm.
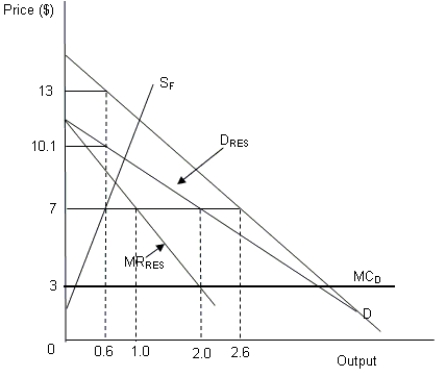
-Refer to Figure .Which of the following price and output combinations represents the overall oligopoly market equilibrium?
A) Price = $3 and output = 2.6 units
B) Price = $10.1 and output = 0.6 unit
C) Price = $7 and output = 2.6 units
D) Price = $7 and output = 1 unit
Correct Answer:

Verified
Correct Answer:
Verified
Q32: In a mixed strategy situation, like the
Q33: The following matrix represents the payoffs to
Q34: A gaming strategy in which one player
Q35: When all players are choosing their best
Q36: In a mixed strategy situation, a player
Q38: The smaller the share of the fringe
Q39: The figure given below represents the output
Q40: Which of the following is a characteristic
Q41: When is a game dominance solvable?
Q42: The figure given below represents the total