Multiple Choice
The figure given below represents the output choices of each of the two oligopolists, given the choices of its competitor.QA and QB are the quantities of output produced by Producer A and Producer B.The marginal cost of production is zero for both producers.
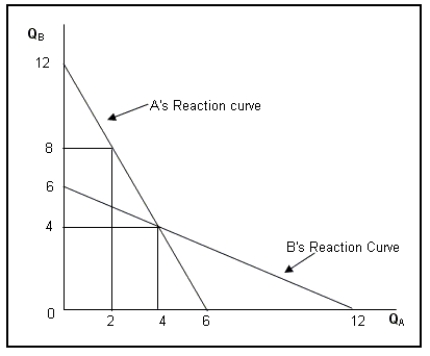
-Refer to Figure .Determine the total production in this market under Cournot equilibrium?
A) 6 units
B) 12 units
C) 8 units
D) 20 units
Correct Answer:

Verified
Correct Answer:
Verified
Q34: A gaming strategy in which one player
Q35: When all players are choosing their best
Q36: In a mixed strategy situation, a player
Q37: The figure given below represents the total
Q38: The smaller the share of the fringe
Q40: Which of the following is a characteristic
Q41: When is a game dominance solvable?
Q42: The figure given below represents the total
Q43: Why do competitive firms enter the market
Q44: In games without dominant strategies the Nash