Multiple Choice
The figure given below represents the total output and price produced in an oligopoly market characterized by a dominant firm and a fringe.SF represents the supply curve of the fringe, D is the market demand curve, DRES represents the residual demand curve of the dominant firm, MRRES represents the residual marginal revenue curve of the dominant firm, and MCD represents the marginal cost of the dominant firm.
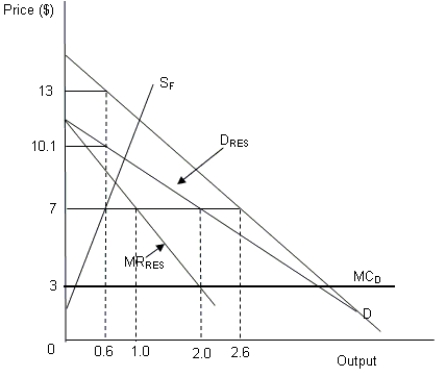
-Refer to Figure .If the market demand curve D rotates outward (while its vertical intercept remains unchanged) , which of the following changes will be observed in the oligopoly market?
A) The fringe's market share will decline
B) The dominant firm's profits will decrease
C) The marginal cost will decrease
D) The overall market price will decline
Correct Answer:

Verified
Correct Answer:
Verified
Q37: The figure given below represents the total
Q38: The smaller the share of the fringe
Q39: The figure given below represents the output
Q40: Which of the following is a characteristic
Q41: When is a game dominance solvable?
Q43: Why do competitive firms enter the market
Q44: In games without dominant strategies the Nash
Q45: The figure given below represents the total
Q46: In a Betrand price-setting duopoly model, the
Q47: The figure given below represents the total