Multiple Choice
The figure given below represents a firm in a market characterized by many buyers and one seller.MC represents the marginal cost, MR the marginal revenue, and D the demand curve of a firm.The firm is initially in equilibrium producing 6 units of output at a price of $10 per unit.
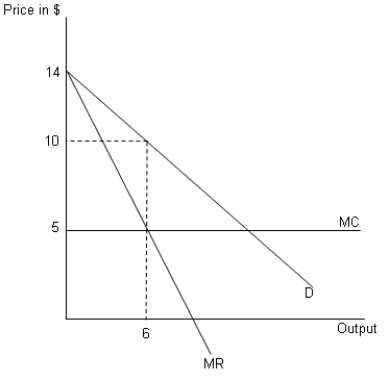
-Refer to Figure .Suppose the adoption of a new cost saving technology lowers marginal cost by $2 although the buyer's valuation remains unchanged.This allows the firm to produce 8 units of output at a price of $8 per unit.The profit earned by the firm will:
A) increase by $10.
B) decrease by $5.
C) remain unchanged.
D) increase by $5.
Correct Answer:

Verified
Correct Answer:
Verified
Q6: In a market characterized by a single
Q7: One possible reason for Wal-Mart's success is
Q8: The figure given below represents a firm
Q9: A firm's resource at a given point
Q10: In the figure given below, Panel A
Q12: In a market characterized by many sellers,
Q13: In the figure given below, Panel A
Q14: What are the benefits of a franchise
Q15: In the figure given below, Panel A
Q16: Which of the following is an example