Multiple Choice
In the figure given below, Panel A represents preexisting firms which are in long run equilibrium at price P₀ and output q₀.MC and AC represents the marginal cost and the average cost of the preexisting firms.Panel B represents a market where every seller has the smallest ability to affect prices.The market is in equilibrium at price P₀ and output Q shown by the intersection of the long-run supply curve (LRS) and market demand (D) .
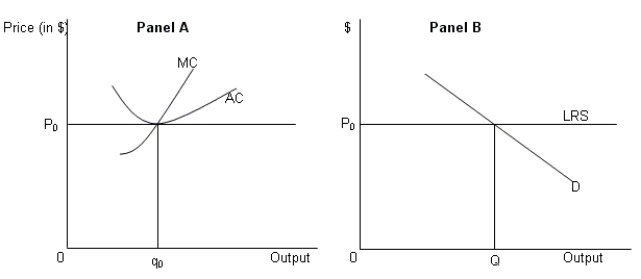
-Refer to Figure .Which of the following can be concluded about the innovative firm which reduces its marginal and average cost by using the new technology?
A) The equilibrium output produced by this firm will increase.
B) The equilibrium output produced by this firm will decrease.
C) This firm will offer its produce at a price below P0.
D) This firm will offer its produce at a price above P0.
Correct Answer:

Verified
Correct Answer:
Verified
Q8: The figure given below represents a firm
Q9: A firm's resource at a given point
Q10: In the figure given below, Panel A
Q11: The figure given below represents a firm
Q12: In a market characterized by many sellers,
Q14: What are the benefits of a franchise
Q15: In the figure given below, Panel A
Q16: Which of the following is an example
Q17: Which of the following is considered per
Q18: Temporary discounts offered to customers by competitive