Multiple Choice
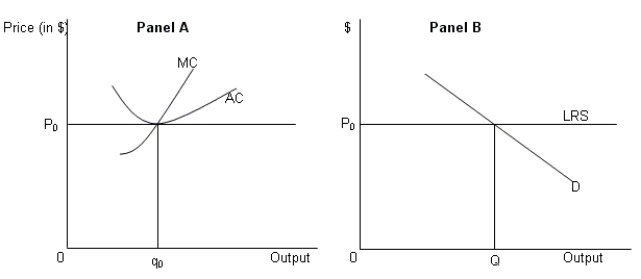
In the figure given below, Panel A represents preexisting firms which are in long run equilibrium at price P₀ and output q₀.MC and AC represents the marginal cost and the average cost of the preexisting firms.Panel B represents a market where every seller has the smallest ability to affect prices.The market is in equilibrium at price P₀ and output Q shown by the intersection of the long-run supply curve (LRS) and market demand (D) .

-Refer to Figure .If a preexisting firm adopts a new cost effective technology (which reduces production costs) .Which of the following changes will be observed?
A) The price level in the market will shift upward.
B) The market demand curve will shift to the right.
C) The LRS curve will shift upward.
D) The MC and AC curves of the innovative firm will shift downward.
Correct Answer:

Verified
Correct Answer:
Verified
Q5: Under which of the following situations would
Q6: In a market characterized by a single
Q7: One possible reason for Wal-Mart's success is
Q8: The figure given below represents a firm
Q9: A firm's resource at a given point
Q11: The figure given below represents a firm
Q12: In a market characterized by many sellers,
Q13: In the figure given below, Panel A
Q14: What are the benefits of a franchise
Q15: In the figure given below, Panel A