Multiple Choice
The figure below shows the supply and demand curves for oranges in Smallville. 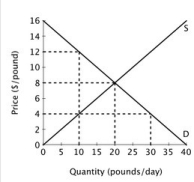 At a price of $4 per pound there will be an excess ________ of ________ pounds of oranges per day.
A) supply; 20
B) demand; 30
C) supply; 10
D) demand; 20
Correct Answer:

Verified
Correct Answer:
Verified
Related Questions
Q86: If you were to start your own
Q87: Consider a perfectly competitive industry in a
Q88: Assume that all firms in this industry
Q89: Suppose the market for coffee is in
Q90: The figure below depicts the short-run market
Q92: If a firm is earning zero economic
Q93: Suppose a small island nation imports sugar
Q94: The figure below depicts the short-run market
Q95: The fact that price subsidies reduce economic
Q96: A cost-saving innovation in a perfectly competitive