Multiple Choice
The figure given below shows revenue and cost curves of a monopolistically competitive firm. Figure: 11.1 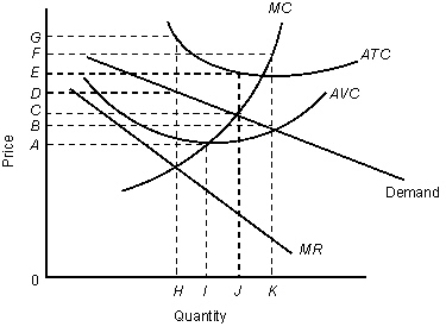 In the figure,
MR: Marginal revenue curve
ATC: Average total cost curve
AVC: Average variable cost curve
MC: Marginal cost curve
-According to Figure 11.1,the firm:
A) 0 and 0.
B) H and D.
C) I and A.
D) J and C.
E) J and E.
Correct Answer:

Verified
Correct Answer:
Verified
Q28: If additional firms enter a monopolistically competitive
Q29: The figure given below shows the revenue
Q31: The firms in an oligopoly market structure
Q33: The following table shows the payoff matrix
Q34: If economic losses exist in a monopolistically
Q35: The table below shows the payoff (profit)
Q36: Which of the following statements about the
Q37: The figure given below shows the cost
Q70: The table below shows the payoff (profit)
Q78: The table below shows the payoff (profit)