Multiple Choice
The figure given below shows the revenue and cost curves of a monopolistically competitive firm. Figure 11.4 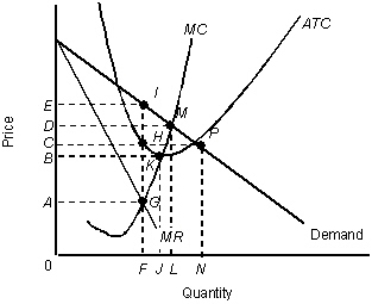
MR: Marginal revenue curve
ATC: Average total cost curve
MC: Marginal cost curve
-Refer to Figure 11.4.What is the profit earned by the firm at equilibrium?
A) 0AGF
B) 0BKJ
C) ACHG
D) AEIG
E) CEIH
Correct Answer:

Verified
Correct Answer:
Verified
Q26: The table below shows the payoff (profit)
Q28: If additional firms enter a monopolistically competitive
Q31: The firms in an oligopoly market structure
Q32: The figure given below shows revenue and
Q33: The following table shows the payoff matrix
Q34: If economic losses exist in a monopolistically
Q64: The figure given below shows the revenue
Q70: The table below shows the payoff (profit)
Q71: The figure given below shows the revenue
Q78: The table below shows the payoff (profit)