Multiple Choice
The table below shows the payoff (profit) matrix of Firm A and Firm B indicating the profit outcome that corresponds to each firm's pricing strategy (where $500 and $200 are the pricing strategies of two firms) . Table 11.2 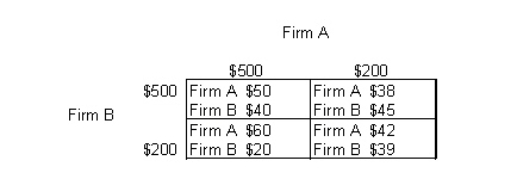
-Refer to Table 11.2.If firm both firm A and firm B choose their dominant strategies then:
A) firm A makes a profit of $40 and firm B makes a profit of $45.
B) firm A makes a profit of $50 and firm B makes a profit of $45.
C) firm A makes a profit of $50 and firm B makes a profit of $40.
D) firm A makes a profit of $42 and firm B makes a profit of $40.
E) firm A makes a profit of $40 and firm B makes a profit of $20.
Correct Answer:

Verified
Correct Answer:
Verified
Q31: The firms in an oligopoly market structure
Q32: The figure given below shows revenue and
Q33: The following table shows the payoff matrix
Q34: If economic losses exist in a monopolistically
Q36: Which of the following statements about the
Q37: The figure given below shows the cost
Q42: The table below shows the payoff (profit)
Q69: The figure given below shows the revenue
Q78: The table below shows the payoff (profit)
Q111: The table below shows the payoff (profit)