Multiple Choice
The table below shows the payoff (profit) matrix of Firm A and Firm B indicating the profit outcome that corresponds to each firm's pricing strategy (where $500 and $200 are the pricing strategies of two firms) . Table 11.2 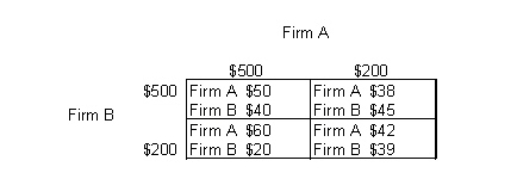
-According to Table 11.2,if firm A follows its dominant strategy but firm B does not,firm A earns a profit of:
A) $50.
B) $40.
C) $60.
D) $45.
E) $42.
Correct Answer:

Verified
Correct Answer:
Verified
Q22: If all the firms in a monopolistically
Q23: When firms use cost-plus pricing in a
Q28: If additional firms enter a monopolistically competitive
Q29: The figure given below shows the revenue
Q29: The figure given below shows the revenue
Q31: The firms in an oligopoly market structure
Q64: The figure given below shows the revenue
Q70: The table below shows the payoff (profit)
Q71: The figure given below shows the revenue
Q78: The table below shows the payoff (profit)