Multiple Choice
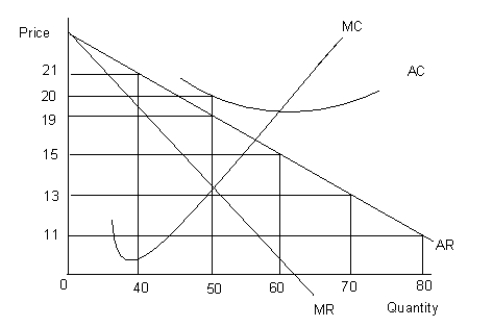
The figure given below shows the revenue and cost curves of a firm. MC represents the marginal cost curve, AC the average cost curve, MR the marginal revenue curve, and AR the average revenue curve.Figure 9.4

-The ordering of market structures from most market power to least market power (where market power is the ability to set its own price) is:
A) monopoly, monopolistic competition, oligopoly, perfect competition.
B) perfect competition, monopolistic competition, oligopoly, monopoly.
C) oligopoly, monopoly, monopolistic competition, perfect competition.
D) monopoly, oligopoly, monopolistic competition, perfect competition.
E) monopoly, perfect competition, monopolistic competition, oligopoly.
Correct Answer:

Verified
Correct Answer:
Verified
Q20: The figure given below shows the revenue
Q21: Scenario 9.2<br>Consider a publicly held firm (one
Q22: The table given below shows the total
Q23: The following figure shows the cost and
Q24: The table given below reports the marginal
Q26: Scenario 9.1<br>Jane left her job at Siemens
Q27: Scenario 9.2<br>Consider a publicly held firm (one
Q28: The following graph shows the demand and
Q29: The figure given below shows the revenue
Q30: Scenario 9.2<br>Consider a publicly held firm (one