Multiple Choice
The figure shows a graph of the temperature of a pure substance as a function of time as heat is added to it at a constant rate in a closed container.If LF is the latent heat of fusion of this substance and LV is its latent heat of vaporization,what is the value of the ratio LV/LF? 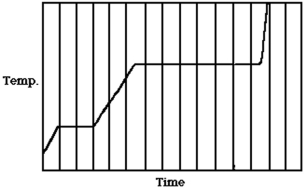
A) 5.0
B) 4.5
C) 7.2
D) 3.5
E) 1.5
Correct Answer:

Verified
Correct Answer:
Verified
Related Questions
Q83: The absolute temperature of a gas is
Q84: At what temperature is the rms speed
Q85: A sealed cylinder fitted with a movable
Q86: Two containers of equal volume each hold
Q87: A brass wire 2.0 m long and
Q88: A sealed container holds 0.020 moles of
Q89: Oxygen molecules are 16 times more massive
Q90: A mole of diatomic oxygen molecules and
Q91: On a cold day,you take in 4.2
Q92: A 50-kg load is suspended from a