Multiple Choice
Exhibit 21-6 The graph below illustrates various cost behavior patterns in XYZ Company.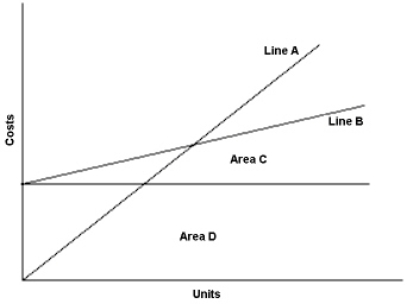
-Refer to Exhibit 21-6. In the graph above, total fixed costs are represented by:
A) Line A
B) Line B
C) Area C
D) Area D
Correct Answer:

Verified
Correct Answer:
Verified
Related Questions
Q1: If the fixed costs relative to a
Q2: Everclean Company cleans draperies. It charges $90
Q3: The per-unit contribution margin is equal to:<br>A)
Q4: C-V-P analysis, while useful for several purposes,
Q5: Company X and Company Y each have
Q7: Exhibit 21-9 Stella Signs sells two different
Q8: Exhibit 21-7 Use the cost-volume-profit graph below
Q9: One method that a multi-product firm can
Q10: The scattergraph method is used to analyze:<br>A)
Q11: Wimmer Company makes swimming suits and