Multiple Choice
Exhibit 21-7 Use the cost-volume-profit graph below to answer the following question(s) .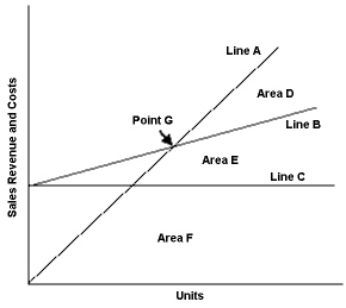
-Refer to Exhibit 21-7. Area F on the cost-volume-profit graph represents the:
A) Revenues
B) Total costs
C) Total variable costs
D) Total fixed costs
Correct Answer:

Verified
Correct Answer:
Verified
Q3: The per-unit contribution margin is equal to:<br>A)
Q4: C-V-P analysis, while useful for several purposes,
Q5: Company X and Company Y each have
Q6: Exhibit 21-6 The graph below illustrates various
Q7: Exhibit 21-9 Stella Signs sells two different
Q9: One method that a multi-product firm can
Q10: The scattergraph method is used to analyze:<br>A)
Q11: Wimmer Company makes swimming suits and
Q12: As activity level increases within the relevant
Q13: Zodiac Company's total costs are increasing in