Multiple Choice
Wimmer Company makes swimming suits and wants to analyze its mixed costs. The diagram below shows a scattergraph representing Wimmer's mixed costs for the previous five months.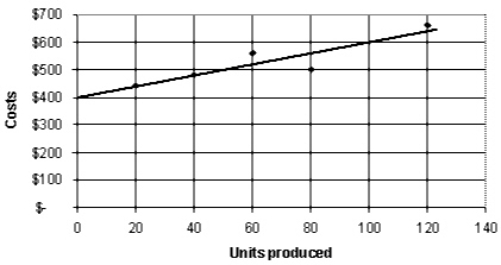
-Refer to Exhibit 21-1. Using the graph above, determine Wimmer's variable cost rate.
A) $1.00
B) $1.25
C) $2.00
D) $2.50
Correct Answer:

Verified
Correct Answer:
Verified
Q6: Exhibit 21-6 The graph below illustrates various
Q7: Exhibit 21-9 Stella Signs sells two different
Q8: Exhibit 21-7 Use the cost-volume-profit graph below
Q9: One method that a multi-product firm can
Q10: The scattergraph method is used to analyze:<br>A)
Q12: As activity level increases within the relevant
Q13: Zodiac Company's total costs are increasing in
Q14: In the scattergraph method fixed costs are:<br>A)
Q15: Exhibit 21-7 Use the cost-volume-profit graph below
Q16: Which of the following is most likely