Multiple Choice
Exhibit 21-7 Use the cost-volume-profit graph below to answer the following question(s) .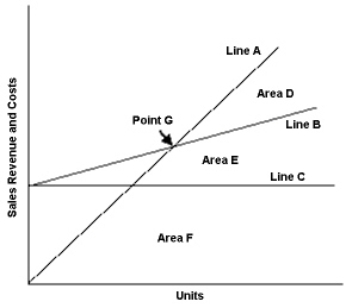
-Refer to Exhibit 21-7. Area E on the cost-volume-profit graph represents the:
A) Revenues
B) Total costs
C) Total variable costs
D) Total fixed costs
Correct Answer:

Verified
Correct Answer:
Verified
Q10: The scattergraph method is used to analyze:<br>A)
Q11: Wimmer Company makes swimming suits and
Q12: As activity level increases within the relevant
Q13: Zodiac Company's total costs are increasing in
Q14: In the scattergraph method fixed costs are:<br>A)
Q16: Which of the following is most likely
Q17: All the following are common cost behavior
Q18: Exhibit 21-5 The following is a partial
Q19: Slaby Motors sells two different products. Following
Q20: Using the following information for Palmer Company,