Multiple Choice
Figure 21-4
In each case, the budget constraint moves from BC-1 to BC-2. 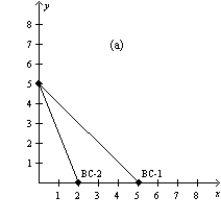
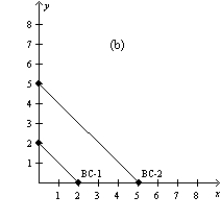
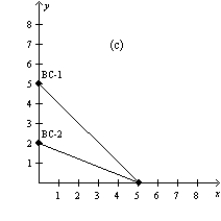
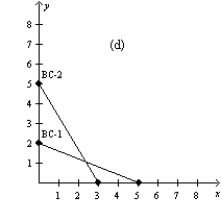
-Refer to Figure 21-4. Which of the graphs in the figure could reflect an increase in income?
A) graph a
B) graph b
C) graph d
D) None of the above is correct.
Correct Answer:

Verified
Correct Answer:
Verified
Q18: Which of the following is a property
Q19: Figure 21-10 <img src="https://d2lvgg3v3hfg70.cloudfront.net/TB1273/.jpg" alt="Figure 21-10
Q20: Gerald spends his weekly income on gin
Q22: Figure 21-14 <img src="https://d2lvgg3v3hfg70.cloudfront.net/TB1273/.jpg" alt="Figure 21-14
Q24: The marginal rate of substitution is<br>A)the slope
Q25: Figure 21-25 The figure pertains to a
Q26: Figure 21-14 <img src="https://d2lvgg3v3hfg70.cloudfront.net/TB1273/.jpg" alt="Figure 21-14
Q27: Figure 21-8 <img src="https://d2lvgg3v3hfg70.cloudfront.net/TB1273/.jpg" alt="Figure 21-8
Q28: Figure 21-11 <img src="https://d2lvgg3v3hfg70.cloudfront.net/TB1273/.jpg" alt="Figure 21-11
Q187: Scenario 21-3<br>Scott knows that he will ultimately