Multiple Choice
Figure 21-5
(a)
(b) 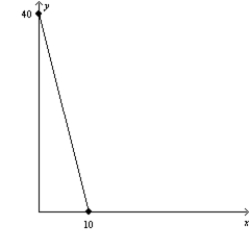
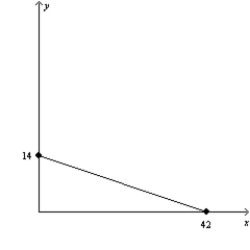
-Refer to Figure 21-5. Assume that a consumer faces the budget constraint shown in graph (a) in January and the budget constraint shown in graph (b) in February. If the consumer's income has remained constant, then what has happened to prices between January and February?
A) The price of X has fallen, but there could not have been a change in the price of Y.
B) The price of Y has fallen, but there could not have been a change in the price of X.
C) The price of X has fallen, and the price of Y has risen.
D) The price of Y has fallen, and the price of X has risen.
Correct Answer:

Verified
Correct Answer:
Verified
Q27: The rate at which a consumer is
Q130: For a typical consumer, most indifference curves
Q364: Figure 21-22 <img src="https://d2lvgg3v3hfg70.cloudfront.net/TB1273/.jpg" alt="Figure 21-22
Q365: The following diagram shows two budget lines:
Q366: Scenario 21-4 Frank spends all of his
Q367: Grace consumes two goods: iced tea and
Q368: If the consumer's income and all prices
Q371: The following diagram shows two budget lines:
Q372: Michael faces tradeoffs between consuming in the
Q374: Figure 21-10 <img src="https://d2lvgg3v3hfg70.cloudfront.net/TB1273/.jpg" alt="Figure 21-10