Multiple Choice
Refer to the following distribution: 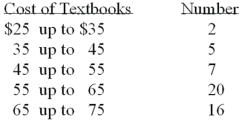 What are the class limits for class with the highest frequency?
A) 55 and 64
B) 54 and 64
C) 55 and up to 65
D) 55 and 64.5
Correct Answer:

Verified
Correct Answer:
Verified
Related Questions
Q14: Refer to the following breakdown of responses
Q17: The following frequency distribution shows the distribution
Q22: The relative frequency for a class is
Q23: Refer to the following breakdown of responses
Q24: Refer to the following breakdown of responses
Q25: To construct a pie chart,relative class frequencies
Q25: To calculate a relative frequency, a class
Q59: A pie chart shows the<br>A)relative frequencies of
Q81: For a frequency distribution of qualitative data,
Q130: A _ is useful for displaying the