Multiple Choice
Refer to the following breakdown of responses to a survey of "Are you concerned about being tracked while connected to the Internet"? 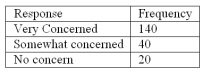 What type of chart should be used to show relative class frequencies?
A) Pie chart
B) Bar chart
C) Histogram
D) Frequency Polygon
Correct Answer:

Verified
Correct Answer:
Verified
Q19: Refer to the following distribution: <img src="https://d2lvgg3v3hfg70.cloudfront.net/TB2538/.jpg"
Q22: The relative frequency for a class is
Q23: Refer to the following breakdown of responses
Q25: To calculate a relative frequency, a class
Q26: Refer to the following breakdown of responses
Q27: A student was studying the political party
Q29: What is the difference in application between
Q37: A frequency distribution groups data into classes
Q77: To convert a frequency distribution to a
Q130: A _ is useful for displaying the