Essay
Refer to the following breakdown of responses to a survey of room cleanliness in a hotel. 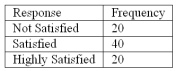 Draw a bar graph that illustrates the frequency table above.
Correct Answer:

Verified
Graph with appropriate labels on horizon...View Answer
Unlock this answer now
Get Access to more Verified Answers free of charge
Correct Answer:
Verified
View Answer
Unlock this answer now
Get Access to more Verified Answers free of charge
Q19: Refer to the following distribution: <img src="https://d2lvgg3v3hfg70.cloudfront.net/TB2538/.jpg"
Q22: The relative frequency for a class is
Q24: Refer to the following breakdown of responses
Q25: To calculate a relative frequency, a class
Q26: Refer to the following breakdown of responses
Q27: A student was studying the political party
Q37: A frequency distribution groups data into classes
Q59: A pie chart shows the<br>A)relative frequencies of
Q77: To convert a frequency distribution to a
Q130: A _ is useful for displaying the