Multiple Choice
Exhibit 19.1 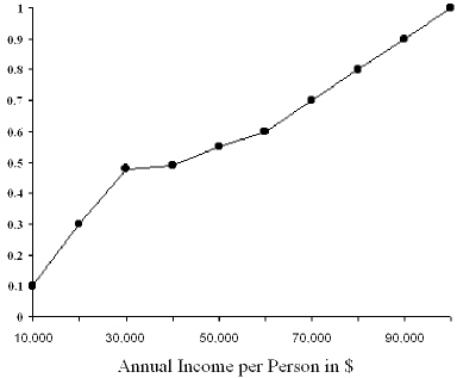 Refer to Exhibit 19.1.The median income in the above figure is
A) $10,000.
B) $20,000.
C) $30,000.
D) $50,000.
E) $100,000.
Correct Answer:

Verified
Correct Answer:
Verified
Related Questions
Q7: Which of the following would be an
Q40: The arithmetic mean value across all responses
Q60: To calculate sampling error for a proportion,
Q66: Which statement(s)pertaining to the chi-square distribution is
Q68: To test directional hypotheses,you would use a
Q69: The one-tailed test is commonly used in
Q70: A researcher calculates a chi-square test statistic
Q72: The logic of hypothesis testing is that
Q75: The one-way tabulation does NOT serve as
Q76: Exhibit 19.6 120 field mice are weighed.The