Multiple Choice
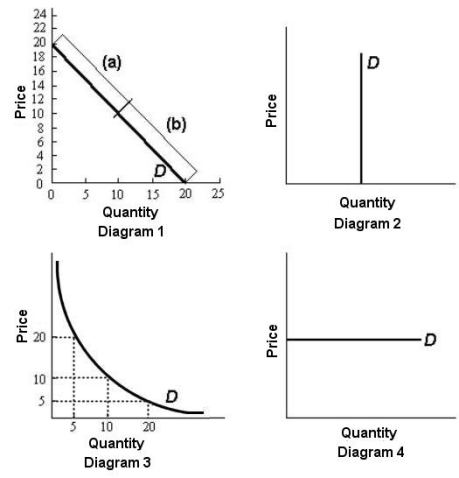 FIGURE 4-2
-Refer to Figure 4-2.There is good reason to suppose that,of the four goods whose demand curves are shown in diagrams 1-4 of the figure,the good that has the fewest close substitutes is shown in
A) diagram 1.
B) diagram 2.
C) diagram 3.
D) diagram 4.
E) There is not enough information to determine this.
Correct Answer:

Verified
Correct Answer:
Verified
Q143: Suppose a market is in equilibrium at
Q144: Consider the following data for a hypothetical
Q145: If the price elasticity of demand for
Q146: What does the following statement imply about
Q147: <img src="https://d2lvgg3v3hfg70.cloudfront.net/TB5441/.jpg" alt=" FIGURE 4-2 -Refer
Q149: <img src="https://d2lvgg3v3hfg70.cloudfront.net/TB5441/.jpg" alt=" FIGURE 4-1 -Refer
Q150: If the income elasticity of demand for
Q151: What does the following statement imply about
Q152: Producers will bear a larger burden of
Q153: Suppose empirical analysis concludes that the income