Multiple Choice
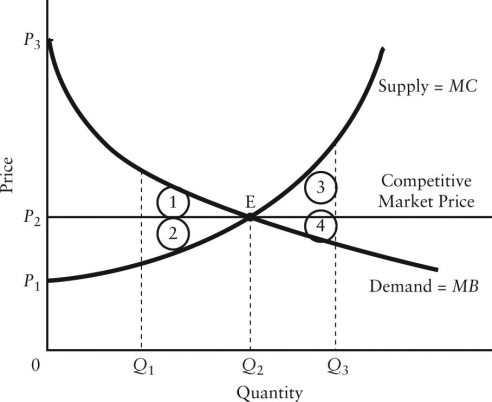
The diagram below shows the demand and supply curves in a perfectly competitive market.  FIGURE 12-5
-Refer to Figure 12-5.In the free-market equilibrium,producer plus consumer surplus is maximized and is illustrated by the area
A) P3P2E.
B) P1P2E.
C) P1P3E.
D) 1 + 2.
E) 1 + 2 + 3 + 4.
Correct Answer:

Verified
Correct Answer:
Verified
Q13: The diagram below shows supply,demand,and quantity exchanged
Q14: The diagram below shows the market demand
Q15: The diagram below shows supply,demand,and quantity exchanged
Q16: In Canada,the Competition Act specifies that in
Q17: In Canada,alleged violations of the Competition Act
Q19: In which of the following situations would
Q20: The diagram below shows the market demand
Q21: The diagram below shows the market demand
Q22: Consider three firms,A,B and C,all producing kilos
Q23: There has been a trend toward less