Multiple Choice
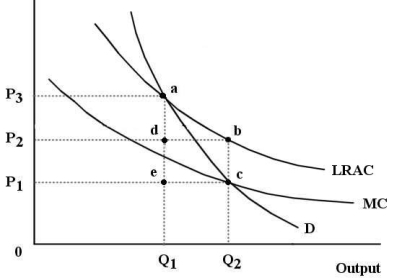
The diagram below shows the market demand curve and the cost curves for a single firm.  FIGURE 12-6
-Refer to Figure 12-6.Suppose this firm is being regulated using the policy of marginal-cost pricing.The resulting price and output would be
A) P2 and Q2.
B) P3 and Q1.
C) P1 and Q2.
D) P3 and Q2.
E) P1 and Q1.
Correct Answer:

Verified
Correct Answer:
Verified
Q16: In Canada,the Competition Act specifies that in
Q17: In Canada,alleged violations of the Competition Act
Q18: The diagram below shows the demand and
Q19: In which of the following situations would
Q20: The diagram below shows the market demand
Q22: Consider three firms,A,B and C,all producing kilos
Q23: There has been a trend toward less
Q24: The Canadian economy is achieving allocative efficiency
Q25: The diagram below shows cost and revenue
Q26: Consider a natural monopoly that has declining