Multiple Choice
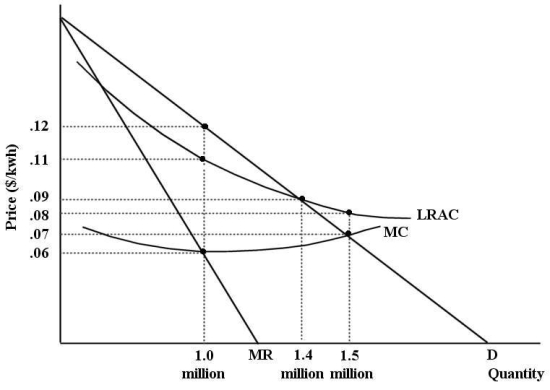
The diagram below shows cost and revenue curves for a natural monopoly producing electricity.Price is dollars per kilowatt hour and quantity is kilowatt hours per day.  FIGURE 12-7
-Refer to Figure 12-7.Suppose this firm is being regulated using a policy of marginal-cost pricing.The resulting price and output would be ________ per kwh and ________ kwh per day.
A) $0.06; 1 million
B) $0.07; 1.5 million
C) $0.08; 1.5 million
D) $0.09; 1.4 million
E) $0.12; 1 million
Correct Answer:

Verified
Correct Answer:
Verified
Q20: The diagram below shows the market demand
Q21: The diagram below shows the market demand
Q22: Consider three firms,A,B and C,all producing kilos
Q23: There has been a trend toward less
Q24: The Canadian economy is achieving allocative efficiency
Q26: Consider a natural monopoly that has declining
Q27: The diagram below shows the demand and
Q28: <img src="https://d2lvgg3v3hfg70.cloudfront.net/TB5441/.jpg" alt=" FIGURE 12-3 -Refer
Q29: The diagram below shows the market demand
Q30: If average-cost pricing is imposed on a