Multiple Choice
A student was interested in the cigarette-smoking habits of college students and collected data from an unbiased random sample of students. The data are summarized in the following table: 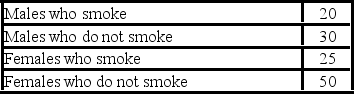 What type of chart best represents the relative class frequencies?
A) Box plot
B) Pie chart
C) Scatter plot
D) Frequency polygon
Correct Answer:

Verified
Correct Answer:
Verified
Q46: A group of 100 students were surveyed
Q47: A frequency distribution is a grouping of
Q48: Refer to the following distribution: <img src="https://d2lvgg3v3hfg70.cloudfront.net/TB2636/.jpg"
Q49: Refer to the following breakdown of responses
Q50: Refer to the following breakdown of responses
Q52: A class interval can be determined by
Q53: In a bar chart,the horizontal axis is
Q54: Refer to the following wage breakdown for
Q55: Refer to the following breakdown of responses
Q56: Refer to the following distribution of commissions: