Multiple Choice
Refer to the following breakdown of responses to a survey of "How confident are you that you saved enough to retire?" 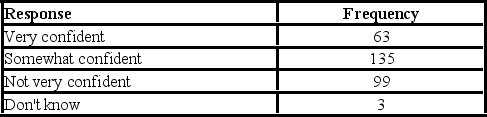 What type of chart should be used to describe the frequency table?
A) A pie chart
B) A bar chart
C) A histogram
D) A frequency polygon
Correct Answer:

Verified
Correct Answer:
Verified
Q50: Refer to the following breakdown of responses
Q51: A student was interested in the cigarette-smoking
Q52: A class interval can be determined by
Q53: In a bar chart,the horizontal axis is
Q54: Refer to the following wage breakdown for
Q56: Refer to the following distribution of commissions:
Q57: A student was studying the political party
Q58: A student was studying the political party
Q59: A pie chart shows the<br>A)relative frequencies of
Q60: In constructing a frequency distribution,the approximate class