Multiple Choice
Refer to the following breakdown of responses to a survey of "How confident are you that you saved enough to retire?" 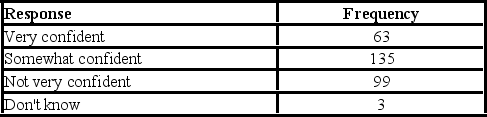 What type of chart should be used to show relative class frequencies?
A) A pie chart
B) A bar chart
C) A histogram
D) A frequency polygon
Correct Answer:

Verified
Correct Answer:
Verified
Q45: When data are collected using a quantitative,ratio
Q46: A group of 100 students were surveyed
Q47: A frequency distribution is a grouping of
Q48: Refer to the following distribution: <img src="https://d2lvgg3v3hfg70.cloudfront.net/TB2636/.jpg"
Q49: Refer to the following breakdown of responses
Q51: A student was interested in the cigarette-smoking
Q52: A class interval can be determined by
Q53: In a bar chart,the horizontal axis is
Q54: Refer to the following wage breakdown for
Q55: Refer to the following breakdown of responses