Multiple Choice
The following figure shows the intersection of demand and supply at the price P2 and quantity Q2 in a competitive market.
Figure 10-2 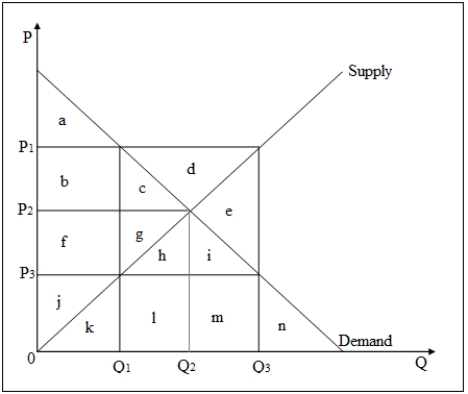
-Refer to Figure 10-2.What is the consumer surplus at the equilibrium level of output?
A) a + b + f + g + h
B) a + b + c + d
C) a + b + c + f + g
D) a + b + c
Correct Answer:

Verified
Correct Answer:
Verified
Q38: Deregulation of the airline industry has resulted
Q48: The following figure shows the intersection of
Q49: The following figure shows the effect of
Q50: The following figure shows the demand and
Q52: Which of the following correctly identifies the
Q54: The following figure shows the intersection of
Q55: The following figure shows the domestic U.S.market
Q57: The following figure shows the effect of
Q58: Suppose the demand for some good
Q66: Which of the following strengthens the possibility