Multiple Choice
The table given below represents the payoff matrix of firms A and B,when they choose to produce low or high output.In each cell,the figure on the left indicates Firm B's payoffs and the figure on the right indicates Firm A's payoffs. 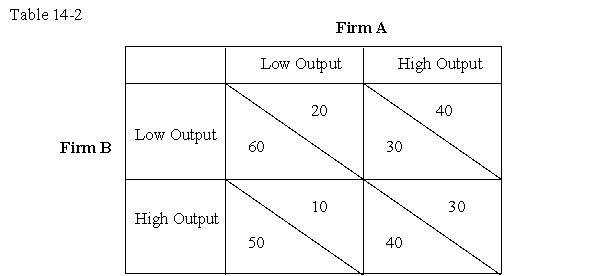
-The information in Table 14-2 implies that the game has:
A) a Nash equilibrium and a dominant-strategy equilibrium.
B) a Nash equilibrium but not a dominant-strategy equilibrium.
C) no Nash equilibrium but has a dominant-strategy equilibrium.
D) neither a Nash equilibrium nor a dominant-strategy equilibrium.
Correct Answer:

Verified
Correct Answer:
Verified
Q6: The table given below represents the payoff
Q10: The table given below shows the payoffs
Q16: Hannah is willing to pay at least
Q18: Under which of the following game theory
Q30: Explain how advertising,when undertaken by all competing
Q32: A representation of how each combination of
Q33: In an oligopoly game,the incentive to cheat
Q54: A Nash equilibrium occurs when:<br>A)a unilateral move
Q62: Which of the following is the best
Q67: Which of the following is likely to