Multiple Choice
FIGURE 8-17 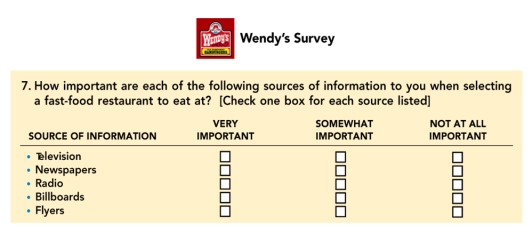
-Which of the following statements most likely explains why Question 7 in Figure 8-17 above was included in the Wendy's Survey?
A) Wendy's wanted to know how many people eat at home while watching TV.
B) Wendy's wanted to know if billboards and other media types were important sources of information to consumers when they decide where to eat.
C) Wendy's wanted to understand how often consumers see flyers.
D) Wendy's wanted to check newspaper circulation in the cities in which it does business.
E) Wendy's wanted to find information about the education level of its customers according to their information sources.
Correct Answer:

Verified
Correct Answer:
Verified
Q78: A picture or verbal description of a
Q79: In marketing, a conscious choice made from
Q80: FIGURE 8-1 <img src="https://d2lvgg3v3hfg70.cloudfront.net/TB4418/.jpg" alt="FIGURE 8-1
Q81: In a decision, the restrictions placed on
Q82: What percentage of sales forecasts are made
Q84: Secondary data can be divided into two
Q85: FIGURE 8-2 <img src="https://d2lvgg3v3hfg70.cloudfront.net/TB4418/.jpg" alt="FIGURE 8-2
Q86: FIGURE 8-13 <img src="https://d2lvgg3v3hfg70.cloudfront.net/TB4418/.jpg" alt="FIGURE 8-13
Q87: Making action recommendations, implementing action recommendation, and
Q88: The purpose of Nielsen's A2/M2 initiative is