Multiple Choice
The graph below includes two plant sizes as illustrated by AC1 and AC2.
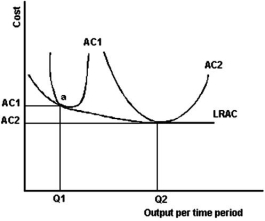
-Refer to the graph above to answer this question.Which of the following statements is correct if a firm is operating at point a on AC1?
A) The firm has achieved capacity output.
B) The firm is achieving MES.
C) An increase in the output would not lower costs.
D) Building a larger plant would result in lower long-run average cost.
E) Building a larger plant would not result in lower long-run average cost.
Correct Answer:

Verified
Correct Answer:
Verified
Q1: <img src="https://d2lvgg3v3hfg70.cloudfront.net/TB5692/.jpg" alt=" -Refer to the
Q2: The long-run average cost curve declines continuously
Q4: The long run is the circumstance in
Q5: What is meant by the term economic
Q6: <img src="https://d2lvgg3v3hfg70.cloudfront.net/TB5692/.jpg" alt=" -Refer to the
Q7: The figure below illustrates a series of
Q8: Which of the following statements is correct
Q9: What is the likely cause of a
Q10: What does the term "minimum efficient scale"
Q11: The table below contains short run average