Multiple Choice
The graph below illustrates three demand curves.
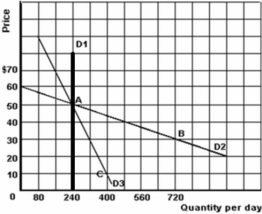
-Refer to the graph above to answer this question.Which of the following statements is correct?
A) The price elasticity of demand between points A and B on D2 is 0.5.
B) D1 illustrates an inferior good.
C) The slope of all three demand curves is constant.
D) The shift from D1 to D2 could illustrate a change in the quantity demanded for a product as a result of a decrease in the price of a substitute good.
Correct Answer:

Verified
Correct Answer:
Verified
Q34: What does the term elastic demand mean?<br>A)Quantities
Q35: The graph below shows the supply and
Q36: <img src="https://d2lvgg3v3hfg70.cloudfront.net/TB5692/.jpg" alt=" -Refer to the
Q37: What does the elasticity coefficient refer to?<br>A)It
Q38: According to Alfred Marshall,time plays a critical
Q40: <img src="https://d2lvgg3v3hfg70.cloudfront.net/TB5692/.jpg" alt=" -Refer to the
Q41: The list below refers to the price
Q42: What is the effect of a rise
Q43: Define each of the following: a)elastic demand
Q44: If people spend a large percentage of