Multiple Choice
The graph below shows the supply and demand for tickets to a Raptors basketball game.
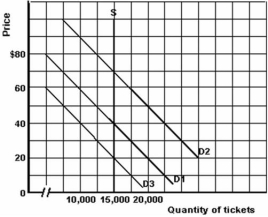
-Refer to the graph above to answer this question.What is the supply elasticity in the $30 to $40 range?
A) 0.
B) 0.26.
C) 2.33.
D) 3.9.
Correct Answer:

Verified
Correct Answer:
Verified
Q30: What is the significance of a positive
Q31: If a product has many substitutes,which of
Q32: What is price elasticity of demand?<br>A)The responsiveness
Q33: Suppose that the price of a product
Q34: What does the term elastic demand mean?<br>A)Quantities
Q36: <img src="https://d2lvgg3v3hfg70.cloudfront.net/TB5692/.jpg" alt=" -Refer to the
Q37: What does the elasticity coefficient refer to?<br>A)It
Q38: According to Alfred Marshall,time plays a critical
Q39: The graph below illustrates three demand curves.<br>
Q40: <img src="https://d2lvgg3v3hfg70.cloudfront.net/TB5692/.jpg" alt=" -Refer to the