Multiple Choice
Three statistics classes (50 students each) took the same test.Shown below are histograms of the scores for the classes.Use the histograms to answer the question. 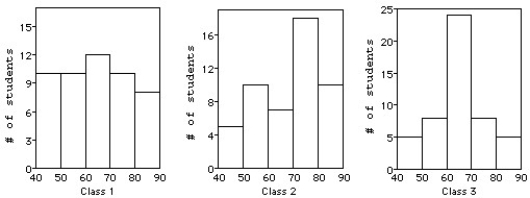
-Which class had the smallest standard deviation?
A) Class 3,because the shape is symmetric and unimodal.
B) Class 3,because the shape has the highest number of students.
C) Class 1,because the shape is fairly symmetric and uniform.
D) Class 2,because the shape is skewed.
E) None,because the classes had the same standard deviation.
Correct Answer:

Verified
Correct Answer:
Verified
Q1: A small company employs a supervisor at
Q31: A dotplot of the number of tornadoes
Q32: The weights (in kilograms)of 27 dogs are
Q33: The histogram displays the body fat percentages
Q34: Which set has the largest standard deviation?
Q35: For class 2,compare the mean and the
Q38: Students were asked to make a histogram
Q39: The histograms show the cost of living,in
Q41: Jody got a bank statement each month
Q138: A clerk entering salary data into a