Multiple Choice
The boxplots display case prices (in dollars) of white wines produced by three vineyards in south-western Ontario.Describe these wine prices. 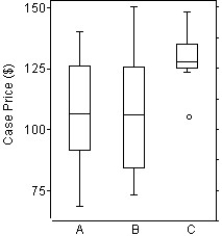
A) Vineyards A and B have about the same average price;the boxplots show similar medians and similar IQRs.Vineyard C has higher prices except for one low outlier,and a more consistent pricing as shown by the smaller IQR.The three distributions are roughly symmetric.
B) Vineyards A and B have different average price,but a similar spread.Vineyard C has lower prices except for one low outlier,and a more consistent pricing as shown by the smaller IQR.
C) Vineyards A and B have about the same average price;the boxplots show similar medians and similar IQRs.Vineyard C has consistently higher prices except for one low outlier,and a more consistent pricing as shown by the larger IQR.
D) Vineyards A and B have about the same average price;the boxplots show similar medians and similar IQRs.Vineyard C has higher prices except for one low outlier,and a less consistent pricing as shown by the larger IQR.
E) Vineyards A and B have about the same average price;the boxplots show similar medians and similar IQRs.Vineyard C has higher prices except for one low outlier,and a more consistent pricing as shown by the smaller IQR.
Correct Answer:

Verified
Correct Answer:
Verified
Q11: Which class had the smallest standard deviation?<br>A)Class
Q26: For class 2,compare the mean and the
Q27: Which class had the smallest IQR?<br>A)Class 1,because
Q37: A small company employs a supervisor at
Q86: Here is a histogram of the assets
Q87: The boxplots display case prices (in dollars)of
Q88: The following data consists of the heights,in
Q91: Members of the Ontario Field Ornithologists (OFO)observe
Q94: The histograms display the body fat percentages
Q108: The free throw percentages for participants in