Multiple Choice
The following data consists of the heights,in centimetres,of 15 randomly selected female high school students and 15 randomly selected male high school students.
Women: 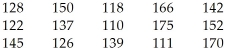
Men: 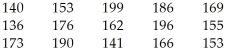
Choose the back-to-back stemplot that represents the given data.
I II III IV 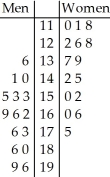
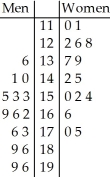
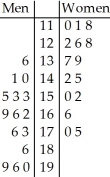
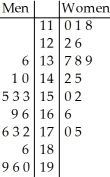
V 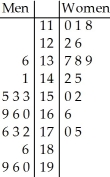
A) I
B) II
C) III
D) IV
E) V
Correct Answer:

Verified
Correct Answer:
Verified
Q11: Which class had the smallest standard deviation?<br>A)Class
Q26: For class 2,compare the mean and the
Q27: Which class had the smallest IQR?<br>A)Class 1,because
Q83: The weekly salaries (in dollars)of 24 randomly
Q84: Shown below are the boxplot and the
Q86: Here is a histogram of the assets
Q87: The boxplots display case prices (in dollars)of
Q90: The boxplots display case prices (in dollars)of
Q91: Members of the Ontario Field Ornithologists (OFO)observe
Q108: The free throw percentages for participants in