Multiple Choice
Members of the Ontario Field Ornithologists (OFO) observe birds at various locations within the province to see how many different species of bird they can spot.Suppose that 21 members have reported spotting the following number of species in 2009.The lower stem contains leaves with the digits 0-4 and the upper stem contains leaves with digits 5-9. 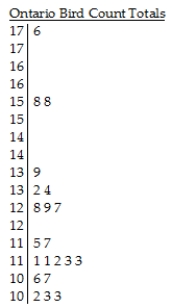
Key:
11 | 5 = 115 birds
A) The distribution of the number of birds spotted by OFO members in 2009 is skewed right,with a centre at around 111 birds.Most members saw between 102 and 176 birds.
B) The distribution of the number of birds spotted by OFO members in 2009 is skewed left,with a centre at around 111 birds.There are several high outliers,with two members spotting 158 birds and another spotting 176.With the exception of these outliers,most members saw between 102 and 139 birds.
C) The distribution of the number of birds spotted by OFO members in 2009 is skewed left,with a centre at around 111 birds.Most members saw between 102 and 176 birds.
D) The distribution of the number of birds spotted by OFO members in 2009 is skewed right,with a centre at around 127 birds.There are several high outliers,with two members spotting 158 birds and another spotting 176.With the exception of these outliers,most members saw between 102 and 139 birds.
E) The distribution of the number of birds spotted by OFO members in 2009 is skewed right,with a centre at around 111 birds.There are several high outliers,with two members spotting 158 birds and another spotting 176.With the exception of these outliers,most members saw between 102 and 139 birds.
Correct Answer:

Verified
Correct Answer:
Verified
Q11: Which class had the smallest standard deviation?<br>A)Class
Q17: Which class had the largest standard deviation?<br>A)Class
Q27: Which class had the smallest IQR?<br>A)Class 1,because
Q37: A small company employs a supervisor at
Q86: Here is a histogram of the assets
Q87: The boxplots display case prices (in dollars)of
Q88: The following data consists of the heights,in
Q90: The boxplots display case prices (in dollars)of
Q94: The histograms display the body fat percentages
Q108: The free throw percentages for participants in